 weflow
Forecasting: Pacing Chart
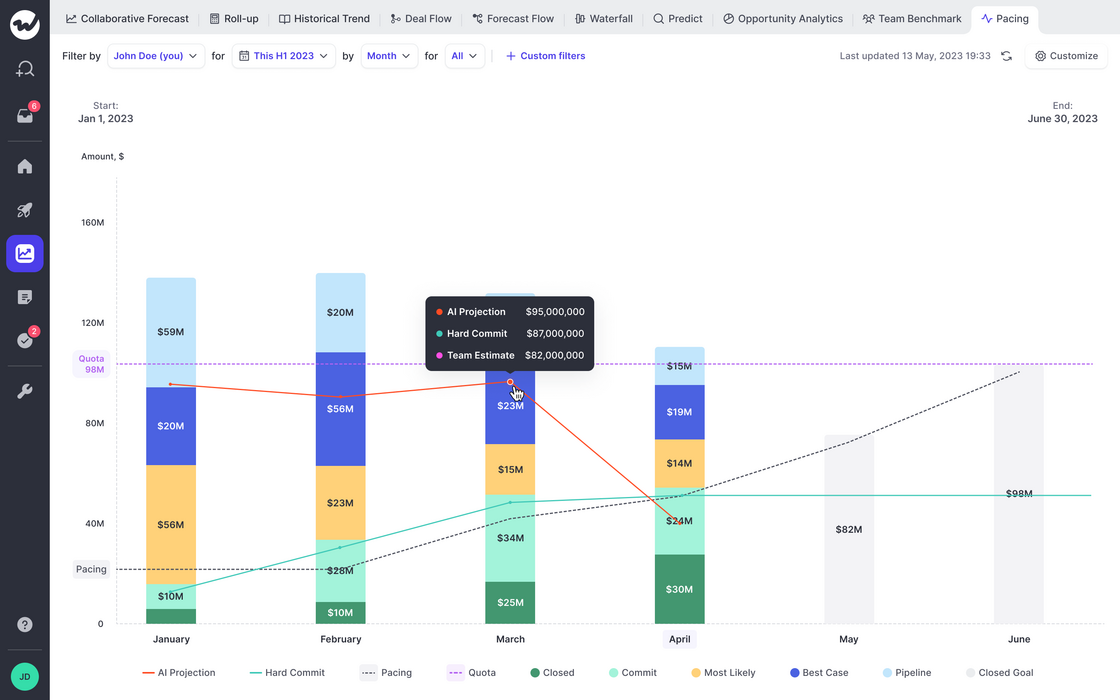
The new pacing chart is perfect for understanding trends in forecasting and quota attainment.
- Weflow will automatically look for historical data of up to 12 months (field history tracking is required)
- If no historic data is available, then only a snapshot of the status quo will be taken instead
- The Pacing chart will tell you how you are moving towards your revenue goals (=quota)
- In addition, you can observe the optimal pacing line and compare the sum of your committed and closed deals against the team call and our own AI projection (currently in beta; coming soon)